`label_percent_cz()` returns a formatter that outputs percent labels with a " `label_number_cz()` uses space as thousand separator and decimal comma. Use these when you need to format labels on something other than X and Y axes
label_percent_cz(
  accuracy = NULL,
  scale = 100,
  prefix = "",
  suffix = " %",
  big.mark = " ",
  decimal.mark = ",",
  trim = TRUE,
  ...
)

label_number_cz(
  accuracy = NULL,
  scale = 1,
  prefix = "",
  suffix = "",
  big.mark = " ",
  decimal.mark = ",",
  trim = TRUE,
  ...
)
Arguments
- accuracy
A number to round to. Use (e.g.)
0.01to show 2 decimal places of precision. IfNULL, the default, uses a heuristic that should ensure breaks have the minimum number of digits needed to show the difference between adjacent values.Applied to rescaled data.
- scale
A scaling factor:
xwill be multiplied byscalebefore formatting. This is useful if the underlying data is very small or very large.- prefix
Additional text to display before the number. The suffix is applied to absolute value before
style_positiveandstyle_negativeare processed so thatprefix = "$"will yield (e.g.)-$1and($1).- suffix
Additional text to display after the number.
- big.mark
Character used between every 3 digits to separate thousands.
- decimal.mark
The character to be used to indicate the numeric decimal point.
- trim
Logical, if
FALSE, values are right-justified to a common width (seebase::format()).- ...
Other arguments passed on to
base::format().
Examples
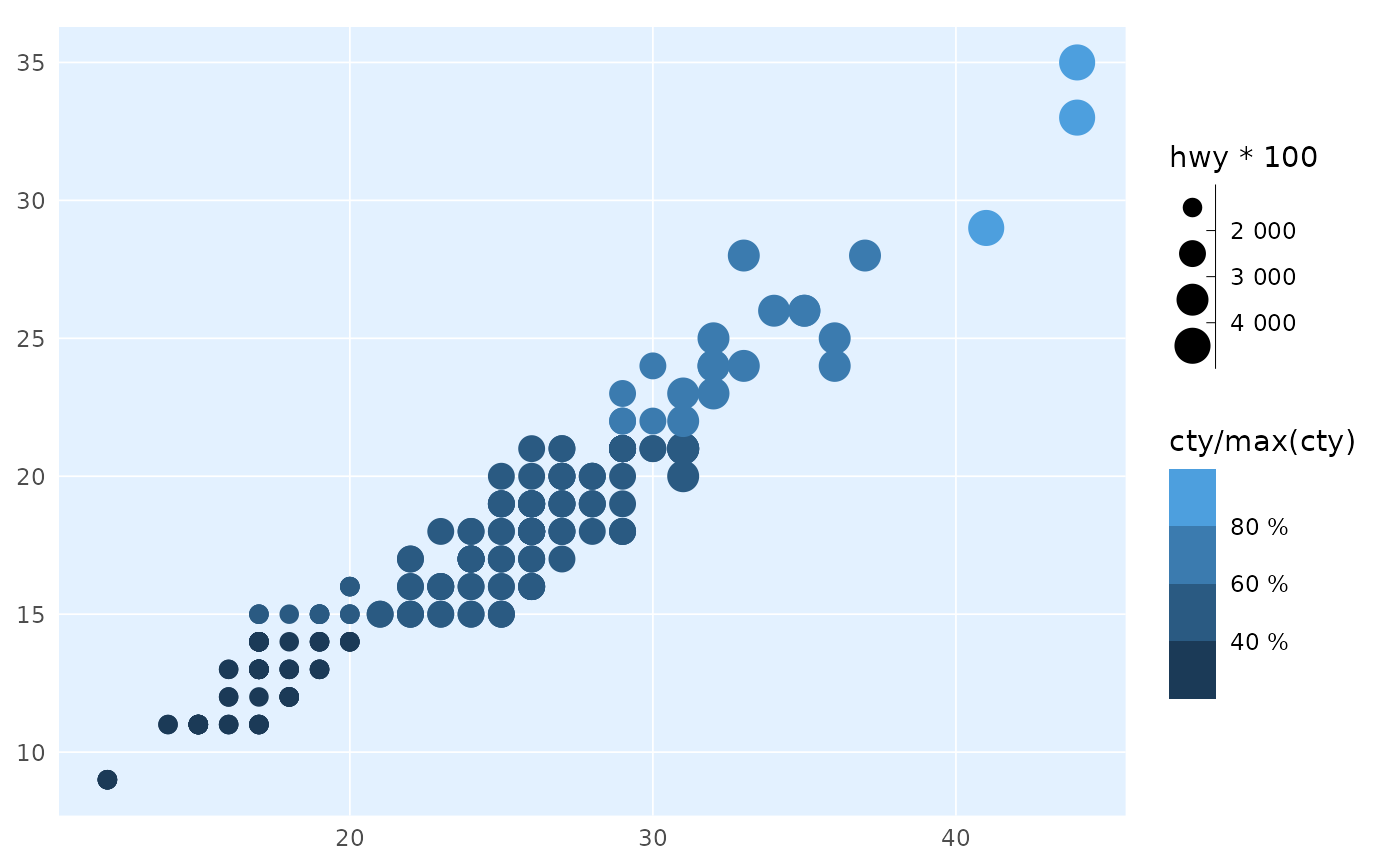
library(ptrr)
library(ggplot2)
ggplot(mpg, aes(hwy, cty)) +
geom_point(aes(colour = cty/max(cty), size = hwy*100)) +
  theme_ptrr(family = "sans", title_family = "sans", gridlines = "scatter") +
  scale_color_binned(labels = label_percent_cz()) +
  scale_size_binned(labels = label_number_cz())