Surviving Data Analysis: An Evaluator’s Gentle Introduction to R
Materials, slides and other background for participants
Training workshop for the 2021 Annual Conference of the Czech Evaluation Society
8 June 2021
This page will contain all materials for the workshop, including slides, and post-workshop ‘what next’ references.
The code for all materials, including this page, is [on Github](https://github.com/petrbouchal/czecheval2021.
The Workshop
What it is about
This workshop is for those overwhelmed with piles of Excel files and “who knows how Alice did this calculation last year in data-final-v2-fin.xlsx” situations. It is also aimed at those who have been gathering up the courage to start programming with data or generally would like to up their data game.
- It will introduce the R programming language and provide a teaser of tools that evaluators will find most handy: project organisation, data input, data transformation and visualisation, accessing and using data from official sources, creating maps and building reproducible reports. You will get your first try of handling data in R and pointers to resources for learning further.
- You will receive instructions for (easy) technical setup before the workshop but you won’t need to install any software on your machine to take part in the workshop.
- No prior knowledge of R or programming is required. If you attended the R data analysis workshop at the 2020 MMR Evaluation conference, this will cover similar ground, with more focus on real-life applications. If you know a bit of R or used it way back in university, this will get you up to date on the R toolkit.
Skills and tools you will encounter
We will focus on tools to let you improve the core steps of any data analysis:
- reading data from common sources (Excel, CSV)
- data cleaning and wrangling (using
dplyrand othertidyversetools) - data visualisation using
ggplot2 - producing reports using Rmarkdown
- accessing and using data from official sources (Eurostat etc.)
- project organisation and basic reproducibility tools and workflows
How we will work
This will be romp through the basic tools you need; we will not go in-depth on all of them, but you will get a sense of how the different parts of the toolkit fit into the data analysis process and where to learn more about them.
We will work with a “whole game” analysis to let you see and experience how these different tools work together to make the whole process of a data analysis more manageable: more effective, transparent, repeatable, and maintainable.
Pre-workshop prep
Technical prep
1. Computer requirements
All you will need for the workshop:
- any computer fast enough to browse the web
- with a modern web browser (Firefox, Chrome, Safari, Internet Explorer 11, Microsoft Edge).
It does not matter what operating system you use.
2. RStudio Cloud
During the workshop, we will use th RStudio Cloud service. That will let us get to work with RStudio and R without needing to install anything. The RStudio Cloud interface looks and works the same as if you installed RStudio on your machine (which you may wish to do later).
(RStudio is one of the applications you can use to do data analysis in R - there are others, in the same way that there are multiple web browsers for viewing the web.)
You will need a free-of-charge account on RStudio Cloud. You can set it up at https://rstudio.cloud/plans/free, entering either your email address or logging in via a Google or Github account. The free tier only provides limited use but will be enough for the workshop session.
3 Downloading the workshop materials
Before the workshop, this page will provide materials for download. As we start the workshop, we will load the materials into RStudio cloud.
Address for loading materials into RStudio Cloud: https://github.com/petrbouchal/czecheval2020
Address for donwloading the materials to your computer: (e.g. for later use; you will not need to download a copy before the workshop) https://github.com/petrbouchal/czecheval2020/archive/main.zip
Repository with all materials and code on Github: https://github.com/petrbouchal/czecheval2020/
At the workshop
To get started, open RStudio Cloud, log in and follow these steps:
- New Project (down arrow) => New project from Git
- paste
https://github.com/petrbouchal/czecheval2021, click Create - run
renv::init()in the Console
This will also work after the workshop if you want to revisit.
Slides
After the workshop
Download your project
If you have your local installation of R and RStudio and you just want to open the project that we worked on anew, you can
- open RStudio
- click File > New project
- from Version Control
- paste
https://github.com/petrbouchal/czecheval2021, click Create(see the “Install R” section on how to install R and RStudio)
If you made any changes to the project in RStudio Cloud that you want to keep, you can do the following to get them onto your machine:
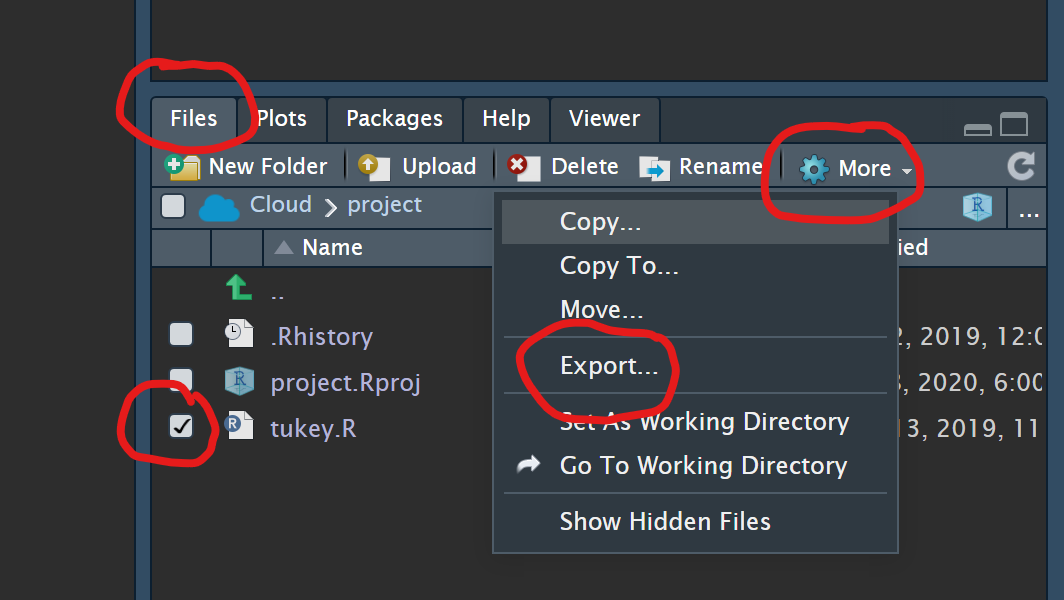
You can unpack the resulting zip file, then click the czecheval2021.Rproj file to open the project in RStudio on your machine.
(see https://community.rstudio.com/t/how-does-one-download-files-from-rstudio-cloud-onto-desktop/52132)
Install R
In short: you need to install
- R (download and install the binary distribution for your operating system)
- then RStudio and then install packages as needed.
To use the project we worked on, you can just run
renv::restore() and all the necessary packages will be
available for this project.
You can follow instructions e.g. from na https://stat545.com/install.html.
A good user-friendly explanation of some of the technical aspects of how to install, configure and maintain an R installation on your machine can be found on rstats.wtf (What they Forgot to Teach You about R).
Keep learning
Explore the case study further
During the workshop, we looked at a case study - a report that integrates code, text and visuals in the output.
If you want to do a bit of follow up after the workshop to keep your learning fresh, I would suggest the following:
- go through the case study (report.Rmd) step by step to make sure you understand what the different steps to
- in the “Per capita numbers” and “Further exercises” sections, take
note of where the
left_join()function is used, try to figure out what it does - also look for where the case study uses geographical data from Eurostat - through the {giscoR} package and statistical data from {eurostat}
- have a look at how the geographical data (NUTS region boundaries) is used and visualised.
Quick start for various tools
Aside from looking at the help pages, you can use cheatsheets by RStudio on various tools/packages:
Intro to R in Czech
The only public intro to R in Czech that I know of is Úvod do analýzy dat v R from the Philosophy Faculty of Charler University (Mazák a Vomáčka 2020)
A more thorough intro to R / tidyverse
All learning resources: https://www.tidyverse.org/learn/
Book: https://r4ds.had.co.nz/introduction.html
Video: https://education.rstudio.com/learn/beginner/
Interactive tutorials: https://rstudio.cloud/learn/primers/
Webinar view: https://rstudio.com/resources/webinars/a-gentle-introduction-to-tidy-statistics-in-r/
“Tips on Learning to Code” from the Modern Dive book (see below)
Selected chapters from [Data Visualization A practical introduction by Kieran Healy (2019)]:
- how to read help pages in R
- working with code in R
- a quick intro to the basic concepts of working with R
- common issues when reading in data
- how to write your first function in R
- how to manage project directories and files
RyouWithMe series
Full-semester R university courses with all materials available online:
- Intro to Data Science, Mine Ceninkaya-Rundel, Uni of Edinburgh
- Stat 545, Jenny Bryan, Uni of British Columbia
A complete list of all online books on R https://www.bigbookofr.com/
A searchable list of all R learning resources: https://www.learnr4free.com/en/index.html
Getting started with R if you know Excel
see this tutorial
Bonus: good practices for storing data in spreadsheets are described in Data Organization in Spreadsheets (Broman & Woo 2017).
Visualising data in R
I warmly recommend the {ggplot2} package - a taster is included in the workshop case study and slides. The intro documentation page for the package also contains references to further resources.
This slide deck serves as a comprehensive showcase of what {ggplot2} can do.
The standard intro to {ggplot2} is ggplot2: Elegant Graphics for Data Analysis (Wickham, Navarro a Lin Pedersen 2020) (3. vydání)
A complete overview to visualising data in {ggplot2} is in the book Data Visualization: A practical introduction (Healy 2019), or Fundamentals of Data Visualization (Wilke 2019).
For web-based or interactive graphics you may want to explore {plotly} and {ggiraph}.
Tables
The most sensible tool for creating good looking tables in reports now seems to be {gt}; you might also be interested in
- {gtsummary}} provides a bunch of extensions for {gt}, including for tabulating model results
- {flextable}
- {kableExtra}
There are great tutorials on using {gt} on Thomas Mock’s blog: [intro to {gt}]{https://themockup.blog/posts/2020-05-16-gt-a-grammer-of-tables/}, 10+ Guidelines for Better Tables in R and more .
A good overview of options for tabulating data is provided in the Rmarkdown cookbook and in this {gt} note
Aside: {skimr} is my favourite package for displaying data summaries.
More on RMarkdown
https://rmarkdown.rstudio.com/ and RMarkdown cookbook.
This covers the various types of outputs you can make in R:
- PDF reports
- Word documents
- webpages and websites
- PDF, Powerpoint and HTML slides
- blogs
- online books
- automated and parametersied reports
If you care a lot about customising Office documents created in Rmarkdown, you might want to look at {officeverse}.
Getting data in and out of R
You will probably use CSV and Excel data as input.
If you need to read in an Excel file, use read_excel()
from the {readxl} package. The help page for the function will tell you
how to read specific sheets or how to handle column types correctly
(dates etc.)
For reading in a CSV file, use read_csv() from the
readr package.
To export data from R into Excel, use the {writexl} package or the
write_excel_csv()/write_excel_csv2() function
from the {readr} package.
There is also a version of CSV-reading functions in {reader} for
reading “European”-style CSV files: decimal comma instead of decimal
point, cells separated by semicolons instead of commas. These are
functions ending in 2: read/write_csv2().
Categorical and text data
If you are used to labelled data from SPSS and Stata, you will find R “factors” familiar: these are columns where individual rows take on one of a finite set of labels, and these labels (called “levels”) can be reordered to change the order in which they appear in tables and charts. Factor columns thus behave differently from character data.
Factor data is best handled using the {forcats} package (a play on “factors”), another tidyverse package. Tha package documentation at forcats.tidyverse.org/ also provides a good intro to working with categorical data in R.
Bonus: recently, the tools available in R for natural language processing and text analysis have been improving fast, including for Czech. A general introduction to text analysis following {tidyverse} principles is available in the open online book Tidy Text Mining in R.
For working with text data, you can use the {stringr} package. The cheatsheet also contains on overview of regular expressions (regex), the general-purpose tool for working with string patterns. If you ever handle tasks like “extract a code from this string which starts with two letters followed by three numbers”, you should look at regular expressions.
How to access useful data in R
Below are some data sources useful for evaluators which are easy to access directly from R:
- Eurostat: {eurostat} R package
- Czech Statistical Office: {czso} R package
- OECD: {oecd} R package
- World Bank: {wbstats} R package
- Státní pokladna MFČR (Czech public budgets data): {statnipokladna} - contains budgets, income and spending and accounting returns of all Czech public sector organisations, including municipalities.
All these packages follow the same workflow: first, download the catalogue of available datasets into R, then find the ID of the desired dataset and load it straight into R as a data frame using a dedicated function, passing the ID as a parameter.
- Czech geographical data produced by the geodata authority ČÚZK: packages {CzechData} a {RCzechia}: they follow similar principles, {RCzechia} also provides access to the ČÚZK geocoding service (“enter address, get coordinates”)
- Eurostat spatial data: {GiscoR} - also includes boundaties of all Czech municipalities. (But watch out for the terms and conditions - give credit and only use non-commercially)
A broader intro at https://petrbouchal.xyz/slides/pssau2020-07/ (now slightly outdated on R packages, but otherwise valid).
Statistics in R
Modelling
- check out the tidymodels suite of packages
- in particular, and even if your modeling situation is quite simple, {broom} is useful for getting consistent outputs from various models for further use on visualisation, tables or metanalysis, or for running many models in parallel
Geographical data and maps in R
R can cover most GIS needs that you would normally handle with QGIS or ESRI, but also allows your spatial and non-spatial tasks to be integrated and all your work to be done in reproducible code.
An excellent open overview of what can be done in R with geospatial data is Geocomputation with R (Lovelace et al. 2019).
The key package to start with is {sf}; it has very good documentation at r-spatial.github.io/sf/.
For visualising spatial data, you can use {ggplot2} or {tmap}, interactive web maps can be made in {mapview} or {leaflet}.
Version control: using git and Github
In order not to get lost in things like
script_done_v2_final3_fin.R, you should start using a
version control system for your code. The most common tool for this is
is git.
The best getting started guide for using git in R is happygitwithr.com/.
A very good conceptual introduction to git for non-programmers is Git for Humans by Alice Bartlett.
Good practice for data analysis in R
To make sure you don’t get lost in your project, you should follow a few good practices around organising your work:
- naming things (files, objects, variables, columns): make sure to read through https://speakerdeck.com/jennybc/how-to-name-files - jsou tam rady užitečné i mimo svět R.
- organising projects in directories: go through https://rstats.wtf/project-oriented-workflow.html
Do ask people, participate or follow along
One of the reasons I advise people to use R is how helpful and welcoming people are in the R community and willing to answer questions and share what they learn.
Search/ask
- Google, of course - often if you get stuck, even googling the error message helps
- on RStudio Community
- on twitter #rstats
- on StackOverflow pod tagem r also with tags named by the relevant package, např. ggplot2.
Participate
Take part in TidyTuesday and RLadies.
Some people also do excellent live/recorded coding sessions on video:
- David Robinson does live codethroughs of TidyTuesday datasets
- Jesse Mostipak does great Twitch videos
Follow along